Auditing,
Forecasting, and Market Research
How They Work Together
The triad of auditing,
forecasting and market research are usually thought of as only attainable using
sophisticated AI software algorithms and technology. The goal of Auditmetrics
is to show that data science does not start with technology but how one
approaches business data analytics with an understanding of the fundamental
principles of statistical analysis.
Auditing, Forecasting, and Market Research
three components are
interconnected in several ways:
1. Data Integrity: Auditing ensures
that the data used in forecasting is accurate and reliable. By verifying the
quality of data sources through audits, organizations can improve the accuracy
of their forecasts. For instance, if an audit reveals inconsistencies in the
administration of sales data collection methods, adjustments can be made to
enhance future forecasting efforts.
2. Revenue Trends:
Forecasting
helps managers guide strategy and make informed decisions about critical business
operations such as sales, expenses, revenue, and resource allocation. Forecasting
adds a competitive advantage and can be the difference between successful and
unsuccessful outcomes. Another benefit is that financial institutions will not
put money in a business if it’s unable to provide a set of thoughtful forecasts.
financial forecasts will also help develop operational and staffing plans that
will make a business more efficient.
3. Informed Decision Making: Market research
provides valuable insights that can guide both auditing processes and
forecasting models. By understanding consumer behavior and market dynamics
through research, organizations can set realistic goals during audits and
create more accurate forecasts that reflect current market conditions.
Continuous
Improvement:
The feedback loop created by these three components fosters continuous
improvement. Audits can identify gaps that can impact forecasting accuracy and
impede meaningful market research methodologies. The audit corrects latent data
issue which can lead to improved forecasting techniques which in turn can lead
to better-informed market research initiatives that align with organizational
goals.
Bringing it Together
In
this section we will go over the transition from the audit to the forecast
using a sample created by the Auditmetrics AI.
1. Data
Integrity
The audit is the
starting point to assure that cashflow is performing with efficiency. A random
sample is of upmost importance in conducting a valid audit. We will not go in
to detail on this step. That is better handled in the “Getting Started”
documentation.
Suppose a fiscal
manager wants to do an audit of a sales account with a million transactions.
The AI process guides the manager to obtain an Excel statistical sample that
can vary from 400 to 1000 records depending on the chosen precision, or as the
pollsters term it “margin of error”. The AI process conforms to AICPA and IRS
standards.
It would be valuable
to review the case studies in chapter 2. Chapter 4 goes into more technical
detail about the issue of statistical efficiency in the context of the sales
tax audit. Spending time to understand statistical efficiency is well worth the
effort (pp. 25,37,41-45,127). It is the pervasive underlying corner stone of
all statistical inference processes for such diverse disciplines as medicine,
economics, physics, biology, opinion polling and other social sciences. Take
the time to understand it rather than pass it on to AI alone to do the thinking.
2. Revenue
Trends
Transition data from audit
to Forecast
Table 1 – Auditmetrics
generated Random Sample that was used for an audit
Table
1 is a condensed exhibit of the sample (n= 1,158) using a 3% margin of error.
In preparing the sample for forecasting two new variables are added. For first
row the new cells are:
Year - Excel function:
=Year(C2)
Month- Excel function:
=Month(C2)
The Excel sample
represents 30 months of data over a 2 ½ year period. It is sorted by Year and
Month by going to “Data” on the top menu and select “Sort”. In the exhibit are
the sort inputs:
The next
step is to create a summary dataset that lists total revenue by month for the 2
½ years. The Excel tool is the Pivot Table. Select the dataset of interest and then
select insert and then Pivot Table.
Figure 1-
The pivot table set up and results
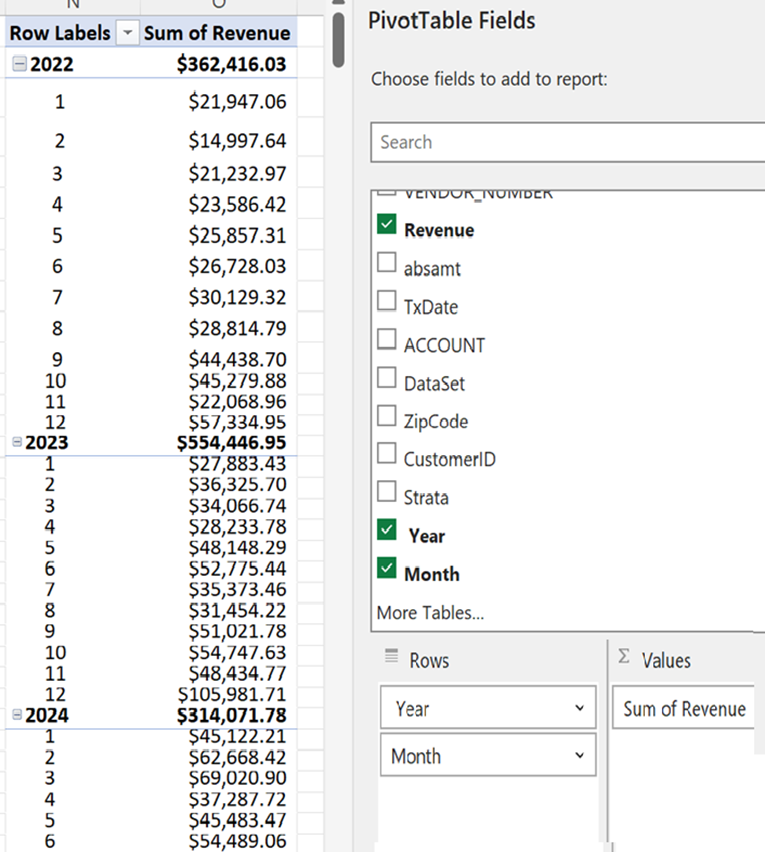
The
resulting data table can now be used for a 30 month forecast
of revenue. Table 2 is a restructuring of the data for using regression to
create a prediction model.
Table 2 –
Dataset for Regression Predictions
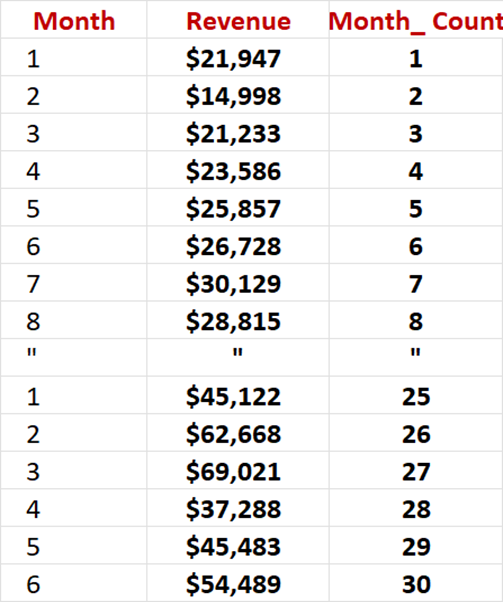
What
is added is a new variable “Month_Count”. Does
Revenue increase as we go from Month 1 to month 30?
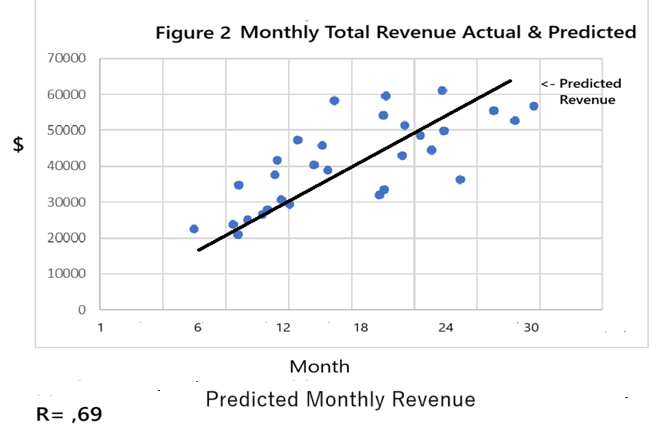
Monthly
Sales =$19,350 + ($1,412
x Month_Count)
A
full discussion of regression modeling is in Springer Appendix I pp. 107-111.
The details of how to use Excel’s ToolPak for
Regression is on pp. 60-67.
Unfortunately,
this regression model is not complete. So far, the basic model is a bivariate
linear model, a dependent variable with only one predictor variable. Though we
have a very good fit, there is a problem with the model.
The data is
that of a wholesaler that supplies retail outlets. With this prediction model
the next month will always be higher than the previous month. But business
activity does have seasonal fluctuations. The fourth quarter of the year and
its holiday activity will always be higher than the following first quarter of
the following year. The model as it exists does not allow for seasonal
fluctuations.
We need a
new multiple regression model with two predictor variable types to perform
monthly and quarterly adjustments. It is a statistical technique that uses several
explanatory variables to predict the outcome of a dependent variable. In essence,
multiple regression is an extension of our current regression model sometimes
referred to as bivariate regression. Multiple regression involves more than one
explanatory variable. in the new forecasting
model are added quarterly variable inputs to the pivot table. The model will
now conduct forecasts that adjust for seasonal fluctuations.
Table 5 –
Quarterly Variable Added
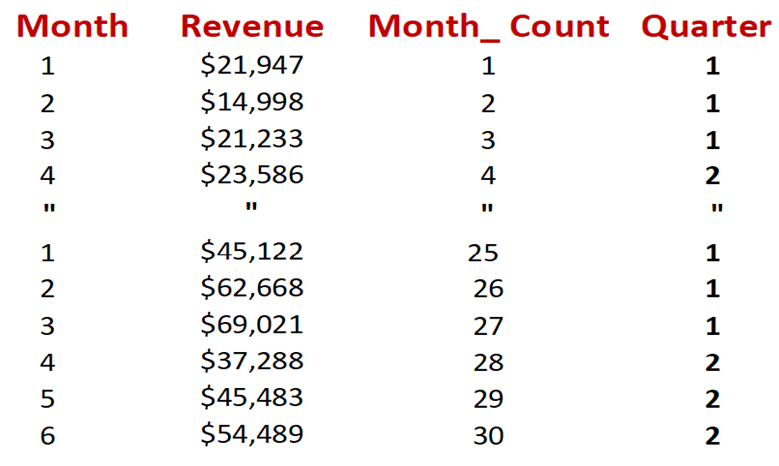
Table 5 adds
the quarterly value for each month. Jan Feb March are all the first quarter of
the year. Month 4 or April starts the second quarter.
The multiple
regression dataset below takes into account seasonal fluctuations.
Table 6 –
First Year Dataset with Quarterly Variables
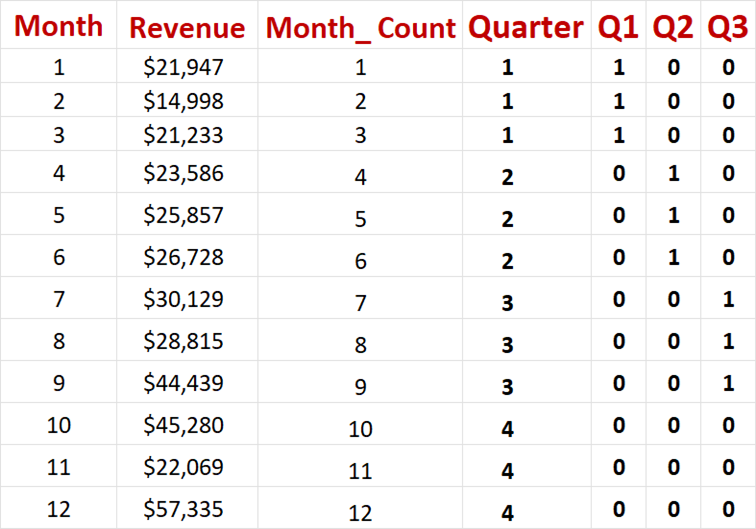
The
rationale and details of introducing the quarterly adjustment variables (Q1,Q2,Q3) is on pp 64-67 in the Springer Book.
The
model as reported by toolpak is:
|
|
Coefficients |
|
Intercept |
28404.26 |
|
Month_ Count |
1210.023 |
|
Q1 |
-8315.13 |
|
Q2 |
-10909.1 |
|
Q3 |
-8472.54 |
This model
has a correlation of R =.78 which
indicates a marked improvement of the model. It would be very useful to review
again Appendix I pp 107-111 regarding the concept of goodness of fit of
the model.
The
following discussion is excerpted from the Springer book. It deals with some
methods of market research that can be readily implemented by small businesses.
3.
Informed Decision-Making
Regression
and Local Market Area -Regression is very valuable in adjusting predictions
using categorical adjustments for various demographics factors such as
geographic region and other characteristics such as gender. Geographic region
can also be a surrogate for income distribution which is readily available from
government published data. For example, there is available through census data
sources that break down income tax collections or median income by zip code.
Such geographic data combined with a company’s sales data with zip codes from
its account record is an indicator of socioeconomic characteristics of a
business’ customer base.
The compilation of this
type of socioeconomic dataset requires time, but gaining insight of the
customer base is invaluable. The first step is to set up a dataset of sales
accounts that include customer zip code.
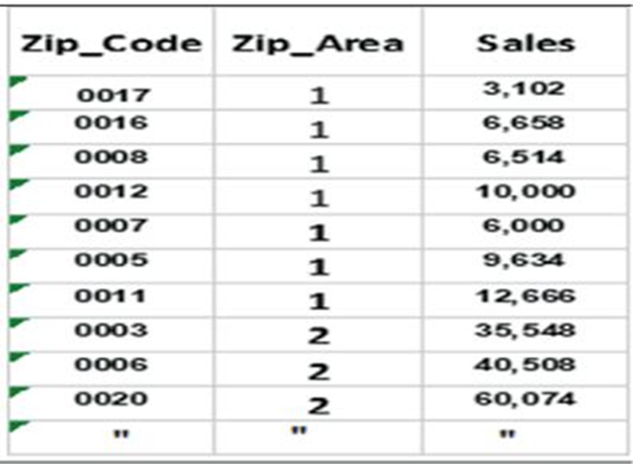
The first step is to group zip codes into
broader zip code areas. This is where background research of examining census
data to develop sociodemographic relevant zip code areas (Table 8.1).
Table 8.1 sales and
sociodemographic research resulted in condensing the data into four geographic
areas. This number was chosen to simplify the presentation of the concept of
using regression to project sales by geographic area. It is most likely that
many more areas would be of value, especially for larger businesses. From a
statistical data perspective, zip codes are categorical data.
Table 8.1 Sales Data by Zip
Code and by Four Geographic Areas
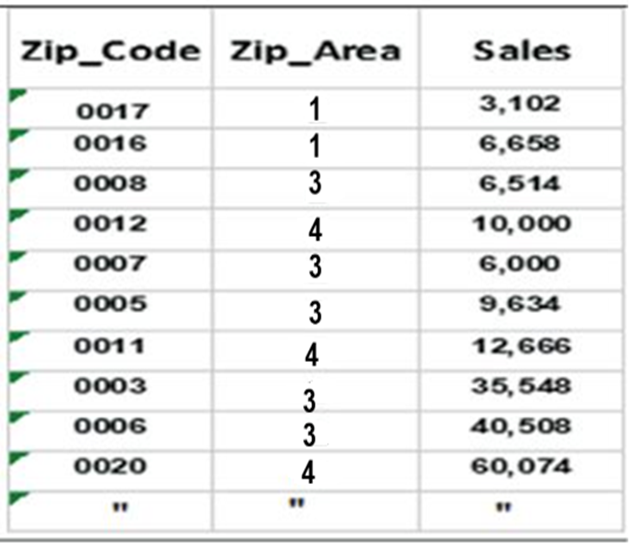
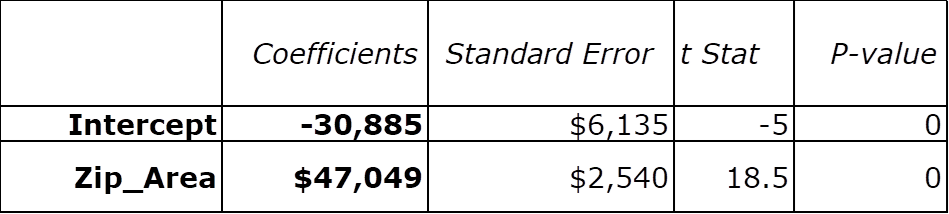
Regression results:

R=.86
R2=.74
Sales = -$30,885 + $47,049 x Zip (Geographic Area number)
Pivot table to summarize
sales by zip code area

As part of small business forecasting,
it is key to get a picture of the possibilities for selling products or
services in a local market. Looking at local markets will provide information
about the types of individuals who might buy products or services and how
extensive is the company’s geographic reach and what is the competition within
the various market areas.
Create a
Customer Profile Next there is a need to
determine who are the people who will buy products or services.
at what
age are they?
What
is their income level?
What
is their education level?
What
kind of jobs do they have?
What do they like to do
for entertainment?
It may be too cumbersome
and difficult for a small business to survey for such data. But a small
demographically diverse focus group is a proven way to measure customer
opinions. It is set up in guided or open discussions about new products or
current views of the company to determine reactions that can be expected from a
larger population. The use of focus groups is a market research method that is
intended to collect data through interactive and directed discussions by an
experienced interviewer. If there are issues with lagging sales that don’t
respond to standard means of marketing, then arranging for a focus group may
be what is needed.
Springer book pp. 81-86 discusses how
to coordinate opinion Likert data with regression projections.
Constant
Monitoring of Business Activities
Regular timely random samples allow the
business manager to deal with small workable subsets of account data
representative of the total book. There is no need to use the gold standard of
3% margin of error with its sample size of 1,152 which should be reserved for
official filings such as for tax agencies or fiscal year end assessments and
reporting.
Regular
routinely smaller samples in the 5% to 7%. range would require samples
approximately 40% smaller reducing cost. Despite the reduced precision of a
single point in time individual estimate, the random process trend over time
will provide a fairly steady indication of trends.
Total Process Overview The overall process in conducting forecasting and market
research is to:
1.
Start with a random sample of
accounts.
2.
From there use regression to project
revenue and expenses.
3.
Also add to the account data pertinent
variables such as geographic and socio-demographic data.
4.
Set up a mechanism to obtain customer
ratings using Likert scales.
5.
The total process from audit to market
research cannot be done without also being closely connected to the personnel
and operations of the business. The major benefit is creating an environment leading
to technology and employee cohesion.
Conclusion: A Synergistic Approach
In conclusion, auditing, forecasting,
and market research work together synergistically to enhance organizational
effectiveness. Ensuring data integrity through audits leads to confidence in the
insights from forecasts and market research.
informed decision-making results in utilizing accurate forecasts for
strategic planning. As a result businesses can achieve greater success in their
operations.
Other Auditmetrics Resources
Auditmetrics Small
Business Power Series books available on Amazon:
Both Kindle and Paper Bound Available
Statistical Audit
Automation
Applying
Artificial Intelligence Techniques
Forecasting Revenue and Expenses for Small
Business Using Statistical Analytics
Market Research for Small
Business
Using Statistical
Analytics
Value Added in Healthcare
and Public Health
Value added is the
extra value created over and above the original value of something
• For private business it is usually the
products sold to the consumer
• It
is the difference between a product final selling price and the direct and
indirect
expenses incurred in providing that product
In healthcare and
public health, the challenge is how to measure value added
•Research into organizations that have
achieved better health outcomes while often
lowering costs suggests a strategic framework
for value-based public health and
healthcare
implementation
•Focusing on health outcomes aligns how
patients experience their health with links to
the investment
incurred
•This
is the basis of cost effectiveness and cost benefit analysis of public health
and
healthcare programs
Also available on Amazon:
HealthLink Wellness: Science for the
Individual